AWSM - ACTIVE WORKERS SERVICE MONITORING
Company : Honeywell
Target Industry : Oil Refinery and Thermal Power Plants
AWSM is an innovative digital platform designed to enhance worker safety and operational efficiency in high-risk environments such as oil refineries, power plants, and thermal facilities.
As the Lead UX Designer, I was responsible for the end-to-end design process — from stakeholder alignment and field research to UX strategy, interaction design, and final prototyping. The goal was to create a centralized, real-time monitoring tool that enables supervisors to track workers’ safety, environmental hazards, and emergency alerts, reducing risks and ensuring compliance with safety protocols.
The outcome was a robust, user-centric system that improved incident response time by 40% and increased supervisor situational awareness by 55%, ultimately elevating worker safety and trust in the organization’s processes.

Initial Problem Statement
"Ensuring safety for workers in hazardous and confined spaces."
Industrial workplaces such as refineries and thermal plants are inherently dangerous, with workers frequently exposed to hazardous gases, extreme temperatures, and confined spaces.
Despite technological advancements, many organizations still rely on manual logs, radio check-ins, and fragmented systems to monitor safety. This results in:
-
Delayed emergency responses
-
Inconsistent data collection
-
Lack of real-time visibility into worker status
-
High risk of human error during crisis situations
The Challenge
Research Process1. Stakeholder InterviewsConducted in-depth sessions with:Safety managersPlant supervisorsOperations directorsFrontline workersKey Insights:Supervisors manage 30–50 workers per shift with minimal digital tools.Workers felt monitored but not supported — they wanted feedback loops, not surveillance.Environmental data (gas levels, temperature) was often reactive, not predictive.2. Field ObservationVisited a refinery site to observe workflows and environmental challenges firsthand.Observed that supervisors relied on paper maps and radio communication, making response coordination difficult.3. Competitive Analysis Reviewed existing IoT-based safety tools. Most lacked: Unified dashboards Predictive analytics Human-centered alert systems
How might we create a digital monitoring system that provides real-time visibility and proactive safety alerts, without overwhelming operators or disrupting worker routines?
Discovery
FACTS
-
Time taken to identify and rescue a worker in need must be reduced.
-
Money spent on worker safety must be reduced.
ASSUMPTIONS
-
Worker will not mind getting tracked in bargain for safety.
-
The shoe is the right Location for the tracking tags.
-
The arm is the right Location for the Panic Button.
-
The daily insertion and removal of pods can be accommodated in the routine.
-
Tech will not be overwhelming for the end users.
%20(6).png)
Research
Stakeholder Interviews
Conducted in-depth sessions with:
-
Safety control room leader
-
Plant/Site supervisors
-
Frontline workers
Field Observation
Visited a refinery site to observe workflows and environmental challenges firsthand.
Observed that supervisors relied on paper maps and radio communication, making response coordination difficult.

Key Insights:
-
Supervisors manage 30–50 workers per shift with minimal digital tools.
-
Workers felt monitored but not supported — they wanted feedback loops, not surveillance.
-
Environmental data (gas levels, temperature) was often reactive, not predictive.
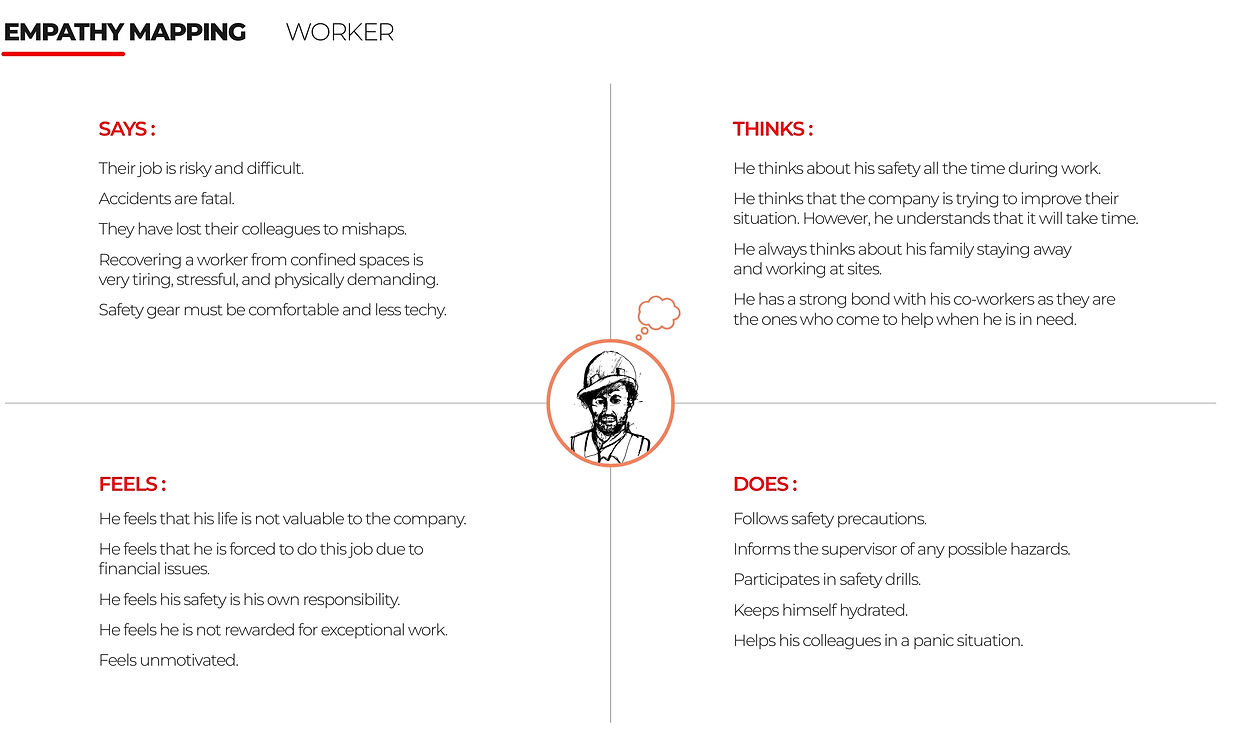
Empathy Mapping


Design Principles
Safety First
Minimal Cognitive Load
Contextual Awareness
Scalable Architecture
Prioritize clarity, visibility, and actionable alerts.
Present only relevant data to each user role.
Use IoT sensor integration for real-time insights.
Adaptable across plants, devices, and environments.
Usability Testing
To validate the effectiveness and intuitiveness of the Active Workers Monitoring System (AWMS), I conducted a series of structured usability tests with both safety supervisors and field workers.
The goal was to ensure that the system’s interaction design, information hierarchy, and alert mechanisms performed well under real-world constraints — including time-critical decision-making and high-stress conditions.
Test Objectives
-
Evaluate the clarity and accessibility of real-time alerts
-
Assess how quickly supervisors could locate a worker in distress
-
Determine whether the dashboard layout supported quick situational awareness
-
Validate the simplicity of completing daily safety reports
Methodology
-
Participants: 8 safety supervisors, 10 field workers
-
Format: Moderated, task-based usability sessions (remote and on-site)
-
Duration: Each session lasted 45–60 minutes
-
Tools: Maze (remote testing), Figma prototype, and screen recording
-
Environment: Simulated refinery scenarios with live alert triggers and mock emergencies
Metrics Captured
-
Task completion rate and time
-
Error frequency (e.g., wrong worker identified, missed alerts)
-
User confidence ratings (1–5 scale after each task)
-
Eye-tracking and click heatmaps for dashboard layout validation
-
Qualitative feedback through post-test interviews
Key Insights
-
Simplifying alert hierarchy reduced confusion during emergencies
-
Supervisors completed emergency response tasks 40% faster than the current process.
-
Color coding of alert levels needed refinement — red/orange hues looked similar under low-light conditions.
User Journey Map
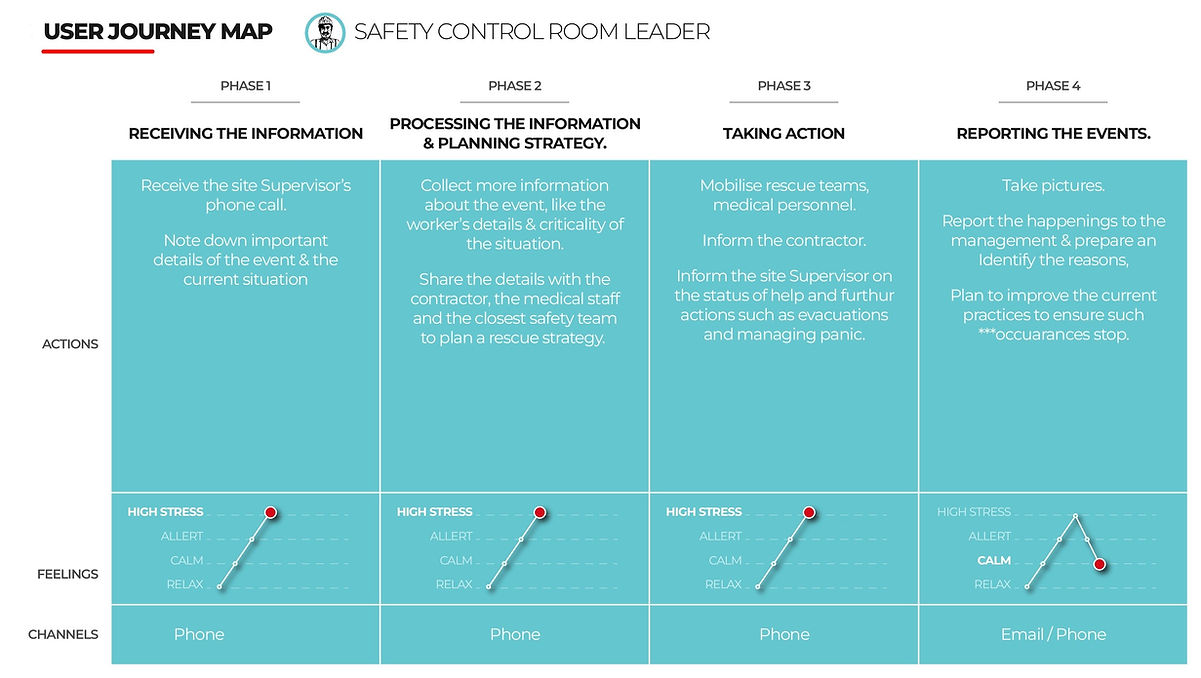
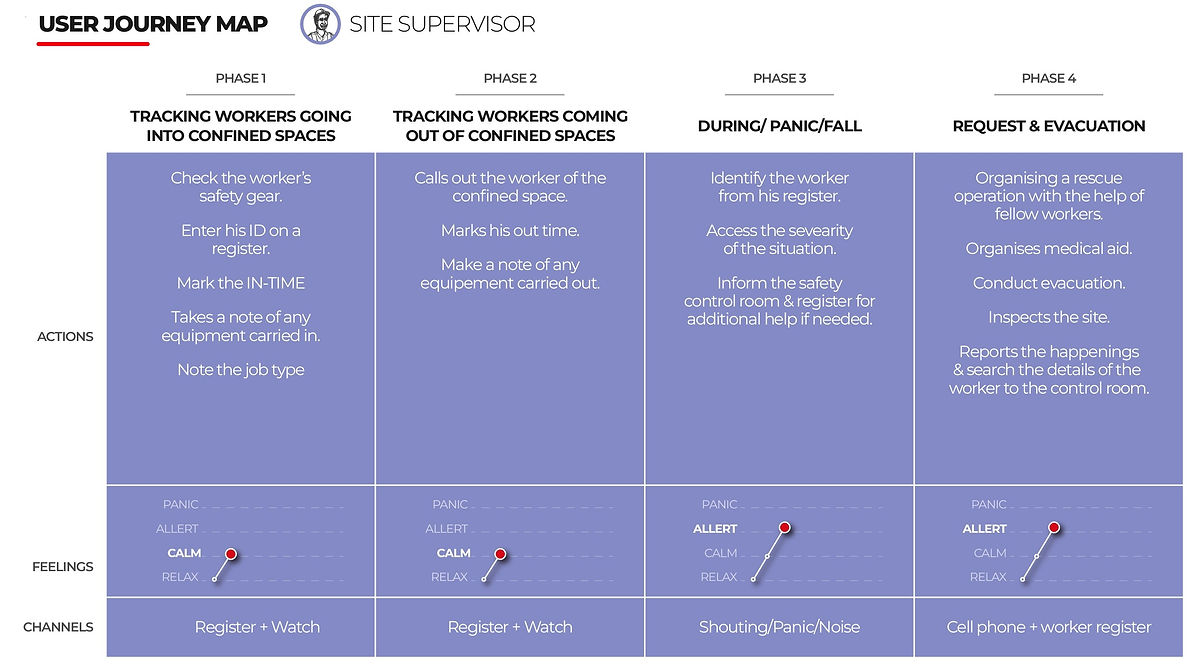

User Journey Map


Key Insights
-
Simplifying alert hierarchy reduced confusion during emergencies
-
Supervisors completed emergency response tasks 40% faster than the current process.
-
Color coding of alert levels needed refinement — red/orange hues looked similar under low-light conditions.
Wireframes (NDA)
Due to confidentiality agreements, detailed screens and wireframes for this project cannot be shared publicly. However, design artifacts and prototypes can be reviewed in a private discussion upon request.
Results & Learnings
Outcomes
-
40% faster incident response times
-
55% improvement in supervisor situational awareness
-
30% reduction in manual reporting effort
-
Positive feedback from frontline workers for “visibility and reassurance”
Key Learnings
-
Empathy in high-risk environments is as critical as technology — workers want to feel supported, not watched.
-
Real-time systems require simplicity over sophistication during crisis scenarios.
-
Cross-functional collaboration with safety engineers enriched the final design integrity.